|
|
|
|
|
||
| Home | ||
| Tutorial | ||
| Case Study | ||
|
|
Manual | |
| Data | ||
| General Info | ||
| Template Matching | ||
| Aligning Datasets | ||
| DTW algorithm | ||
| Thanks | ||
| Download | ||
| Manual | |||
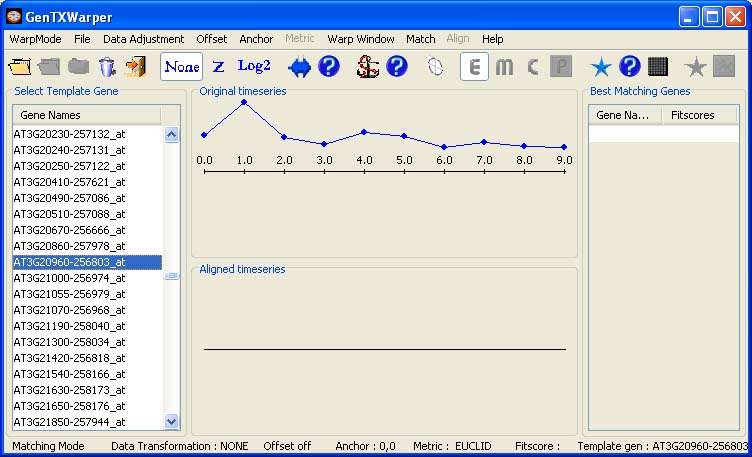
Template Matching Session The template matching mode allows to mine gene expression time series for patterns that fit best a template expression profile provided by the user. A gene expression time series file is supplied as an input and consequently, the content of the left most column of the expression file is loaded into the left window. The gene expression time series used in the examples below is coming from the aphidicolin addition synchronization experiment of Menges et al., 2003(1)(Data). The interface of the template matching mode enables the user to select the expression profile of a gene of interest as a template by simply scrolling up and down the list of gene names in the left window. The expression profile of the selected gene is plotted in the middle top window in blue.
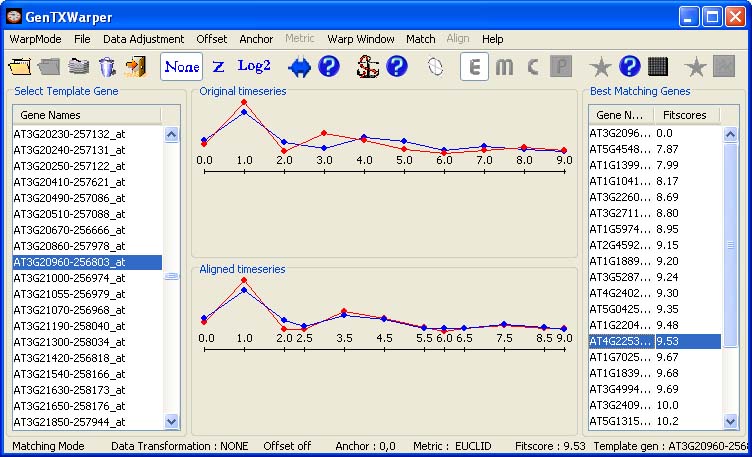
The number N of the top matching genes to be outputed by GenTχWarper can be specified in the Match menu, by default N=25:
After choosing Match! from the Match menu, the N best matching genes together with their fitscores will appear in the right window.
Note that
the match function can alternatively be used
via the tool bar buttons:
Further, one can proceed by selecting any gene from the N best matching list. Consequently, the expression profiles of the selected gene (in red) and the template (in blue) will be visualized in the middle window: 1) as originally positioned in time (top panel); 2) as aligned by the DTW algorithm (bottom panel). In the example below, there is no difference between the top and the bottom plots since the optimal alignment between the two profiles does not require warping of the time axis.
Let us select another gene in the right window. The view in the middle top window below, indicates very comparable behaviour between this gene and the gene operating as a template. However, there is clearly a phase shift arround time points 3 and 4. The plot in the bottom window presents the best possible time alignment between the two expression profiles. Note that extra time points have appeared as a result of the warping performed on the time axis. These are the average values of the time points in the alignment that have been matched against each other. For instance, time point 4 from the blue profile has been aligned agains time point 3 from the red profile and consequently, new time point 3.5 has been created.
Data Adjustment The template matching sessions above were performed over absolute expression values. In many cases however, it may be desirable to compare the relative amounts of variation of different genes. One possibility is to standartize the genes by applying z-transformation (General Info). The result of a template matching session with the same template as above, but when the data is z-transformed, is presented below.The two genes compared are different in absolute expression amplitude, but they are very similar in relative expression variation over all the time points. Consequently, the optimal alignment between their z-transformed profiles is achieved with a limited warping of the time axis.
Another possible data adjustment that allows comparing relative expression values is log2-transformation of expression ratios relative to the expression in time zero (General Info). The result of a template matching session with the same template as above, but when log2-transformed, is presented below.
Applying an Offset The offset function enables sliding the time series against each other along the time axis (General Info). In the context of the template matching mode, applying an offset can be useful in the following cases: 1) Many biological processes, as for instance cell cycle, are conserved between species, and for a given gene with a known function in one species, one may attempt to identify a set of genes in another species with a potentially similar function. However the duration of the different cell cycle phases may vary considerably between species and one way to correct for this is to apply an offset, eventually in a combination with an anchor point (see below), that positions the corresponding cell cycle phases of interest against each other. Otherwise one risks to identify many genes that pick more or less at the same time, relative to time zero, as the template gene, but in completely different cell cycle phase. 2) Additionally, the offset parameter can be useful for performing "causality searches" as they were named by Aach and Church, 2001(2). By specifying a non-zero offset one may slide the sets of expression profiles against each other along the time axis, in this way discovering genes with similar trajectories but shifted in time. Thus putative targets of a known transcription factor can be identified by using its profile as a template and evaluating the list of the best matching genes for different offset values (see of Zhu et al., 2002(3)). The example below illustrates the result of a template matching session with the same template as above and an offset parameter set to 1. This actually implies a partial alignment of the expression profiles. The blue profile (the template) is shifted with 1 time point to the right of time zero and the alignment is performed only on the parts of the profiles that ovelap.
Analogously, in the figure below, the offset parameter has been set to -2. Consequently, the red profile has been slided 2 time points to the right of time zero and the alignment has been performed over the time interval [2,9].
Using an Anchor Point The anchor point option provides the possibility to explicitly align a time point from one time series with a time point from another time series and can be used in similar cases as the ones listed above for the offset. For instance, setting an anchor point may be very useful in case there is detailed information about the exact times when the compared biological processes go through some fixed state. Suppose one is searching a gene expression time series for paterns with some characteristic feature (e.g. a pick value) in a certain time point. Defining an anchor point in this time point will suppress warping it against another time point during alignment. Consequently, it is expected that majority of the best matching profiles will have the specific features one is interested in. The example below illustrates the result of a template matching session with the same template as above and an anchor point with coordinates (1,2). Thus time point 1 of the blue profile is explicitely aligned with time point 2 of the red profile. Note that, in contrast to the offset parameter, a global alignment of the expression profiles is performed.
Computation of a Pairwise DTW Distance Matrix This feature of the template
matching mode enables the computation of a gene
pairwise DTW distance matrix for a given
microarray data set. It can be selected from the
Match menu by clicking on Create
Distance Matrix or equivalently, by using the tool bar button:
A diagonal matrix of DTW distances is created either in excel or in tab-delimited text format, depending on the choice of the user. The computational time required for the creation of a pairwise distance matrix depends on the size of the input data set and could be rather long for large microarray data sets. For instance, a pairwise distance matrix for an expression data of a dimension 3000 genes by 10 time points will be generated in about 30 minutes in case no warping window constraint is applied. The usage of a warping window can lead to about 20% relative reduction of this time.
(1) Menges,M., Henning,L., Gruissem,W., Murray,A.H. Genome-wide gene expression in an Arabidopsis cell suspension. Plant Molecular Biology, 53, 423-442 (2003). (2) Aach,J. and Church,G.M. Aligning gene expression time series with time warping algorithms. Bioinformatics, 17, 495-508 (2001). (3) Zhu,Z., Pilpel, Y., Church,G.M. Computational identification of transcription factor binding sites via a transcription-factor-centric clustering (TFCC) algorithm. J. Mol. Biol., 318, 71-81 (2002).
|
|