|
|
|
|
|
||
| Home | ||
| Tutorial | ||
| Case Study | ||
| Manual | ||
| DTW algorithm | ||
| Thanks | ||
| Download | ||
| Tutorial | ||||||
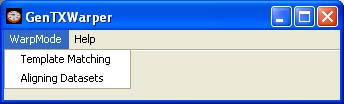
GenTχWarper operates in two main modes: template matching mode and aligning datasets mode. The template matching mode allows to mine gene expression time series for patterns that fit best a template expression profile provided by the user. The alignment mode allows finding the best time alignment between two sets of gene expression time series. The working mode must be selected at the start from the WarpMode menu.
At any time during the run of GenTχWarper the working mode can be changed. However, bear in mind that by switching from one mode to another you will loose the results obtained in the former one, unless you have saved them to a file before moving to another mode.
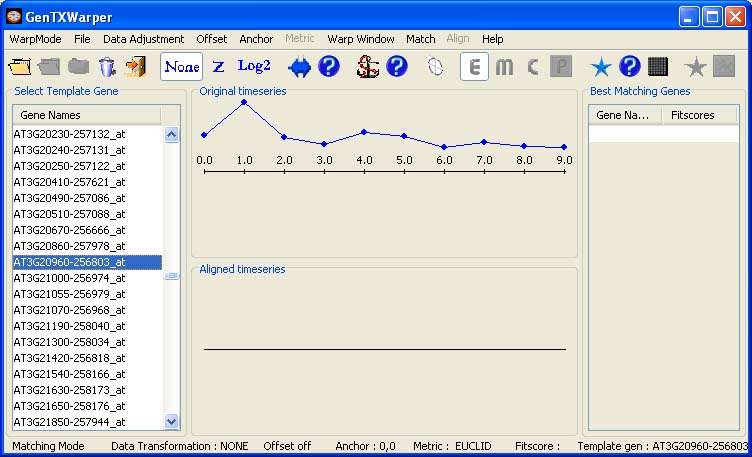
One gene expression time series file needs to be loaded in this mode and the content of its left most column (gene identifiers) is displayed in the left window. The gene expression time series used in the example below is coming from the aphidicolin addition synchronization experiment of Menges et al., 2003(1)(Data). Next the expression profile of any gene of interest can be selected as a template by simply scrolling up and down the list of gene names in the left window. The expression profile of the selected gene is plotted in the middle top window in blue.
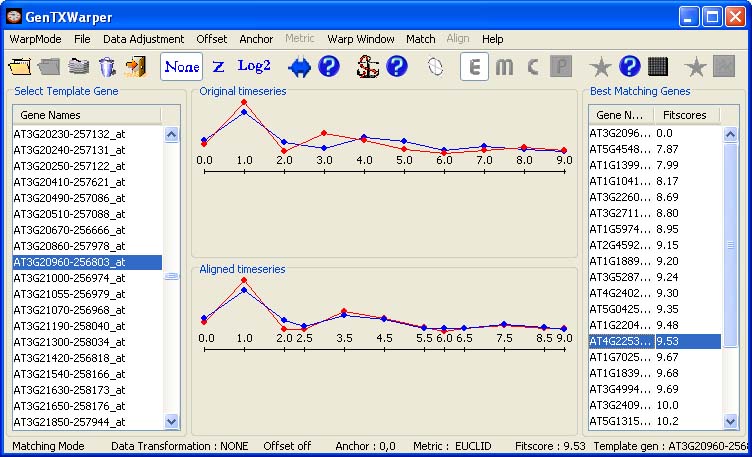
After choosing Match! from the Match menu, the N best matching genes together with their fitscores will appear in the right window. Further, one can proceed by selecting any gene from the N best matching list. Consequently, the expression profiles of the selected gene (in red) and the template (in blue) will be visualized in the middle window: 1) as originally positioned in time (top panel); 2) as aligned by the DTW algorithm (bottom panel).
The view in the middle top window below, indicates very comparable behaviour between the two genes. However, there is clearly a phase shift arround time points 3 and 4. The plot in the bottom window presents the best possible time alignment between the two expression profiles. Note that extra time points have appeared as a result of the warping performed on the time axis. These are the average values of the time points in the alignment that have been matched against each other. For instance, time point 4 from the blue profile has been aligned agains time point 3 from the red profile and consequently, new time point 3.5 has been created. The template matching scenario that has been demostrated above is a rather trivial one. For more elaborated features, as for instance data adjustment, offset, anchor points, etc., please consult the manual (template matching mode).
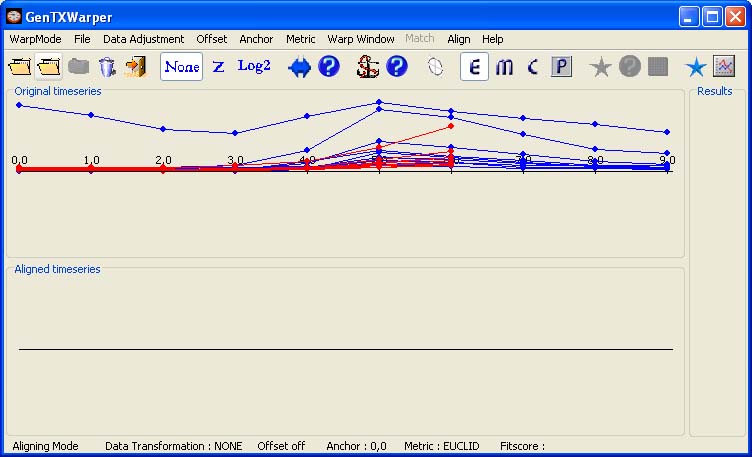
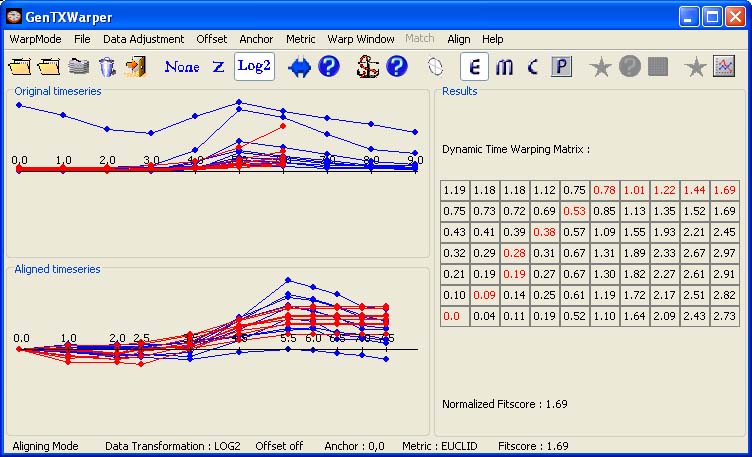
Two separate input files, each containing a set of gene expresion time series to be compared, are required. The files are supposed to have the same number of profiles and the corresponding profiles must appear respectively in the same order in both files. In the example below, the time expression profiles of all CYCB genes from the aphidicolin addition synchronization experiment of Menges et al., 2003(1) (Data) have been loaded into GenTχWarper and displayed in blue. Next, the time expression profiles of all CYCB genes from the sucrose starvation synchronization experiment of Menges et al., 2003(1) (Data) have been loaded and displayed in red.
The two sets of expression profiles have been generated in different experimental conditions and consequently, the comparison of their absolute expression values will not be very meaningful. Therefore before proceeding with aligning the two sets of profiles it is better to transform them to relative expression values by aplying log2-transformation (Data). Then the two time series can be aligned by simply selecting Align! in the Align menu.
The two visualization panels provide a comparative view of 1) the original expression profiles (top panel); 2) their aligned with the DTW algorithm counterparts (bottom panel). Additionally, GenTχWarper reports in the right window the DTW matrix with the optimal warping path through it indicated in red, and the final fitscore after normalization. The performance of the alignment algorithm is subject to modification via several parameters: data adjustment, distance metric, warping window, offset and anchor point. The usage of these is discussed in a detail in the manual (alignment mode).
(1) Sakoe,H. and Chiba, S. Dynamic programming algorithm optimization for spoken word recognition. IEEE Trans. on Acoust., Speech, and Signal Process., ASSP 26, 43-49 (1978).
|
|
|