|
|
|
|
|
||
| Home | ||
| Tutorial | ||
| Case Study | ||
| Manual | ||
| DTW algorithm | ||
| Thanks | ||
| Download | ||
| Case Study | |||||
Recall that the template matching mode of GenTχWarper allows to mine gene expression time series for patterns that fit best a template expression profile provided by the user. The template matching performance may vary considerably however, depending on the data adjustment applied. Here, we illustrate this phenomenon with a small example. Our test gene expression time series is coming from the Arabidopsis aphidicolin synchronization experiment of Menges et al., 2003(1)(Data) and consists of 3277 genes (selected based on p-values for regulation) sampled 10 times over a period of 19h. We have randomly selected 18 histones from the test set and each one of them was used as a template in 3 template matching sessions with GenTχWarper. Namely, the test gene expression time series has been used: 1) without applying any data adjustment (referred as dtw); 2) z-transformed (referred as dtw-z); 3) log2-transformed (referred as dtw-log2). Subsequently, for each histone-template the number of occurrences of other histones or histone annotated genes in the list of the first 50 best matching genes has been recorded. These are summarized in the table below for each of the 3 template matching sessions, respectively: dtw, dtw-z and dtw-log2. Additionally, the total number of unique histones selected for all the sessions and a Venn diagram illustrating the overlap between the sets of histones picked up by each of the sessions are reported in the last two columns. Alternatively, a pdf version of the same table can be found here histones table.
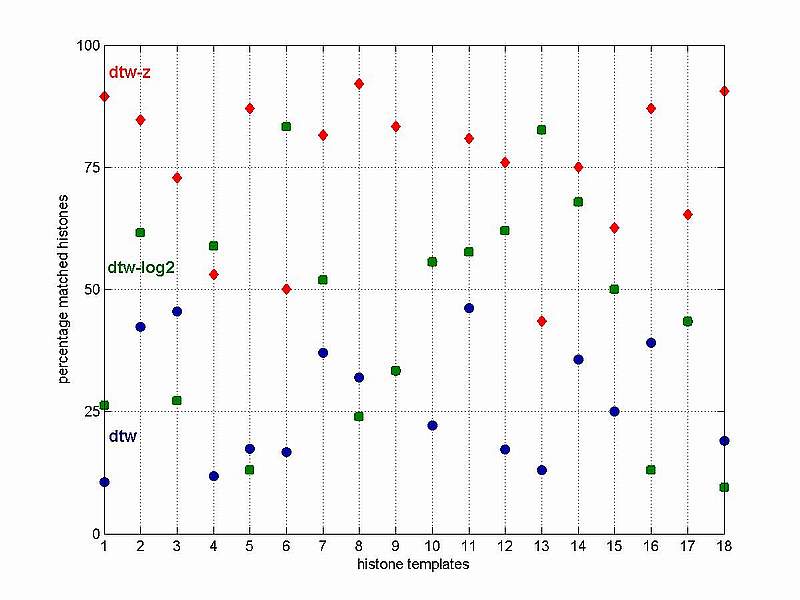
The reasoning behind our test is the fact that the histones are known to have very consistent behaviour during cell cycle. They are often used as markers for the S-phase and it is naturally to expected that their time expression profiles are very conserved. Thus a best matching gene list enriched with histones is a good indication for an adequate template matching performance. It is surprising to encounter that the difference in performance between the 3 template matching sessions is considerable and what is even more surprising how small the overlap between them is. Actually, the most frequent number of histones picked up by all 3 template matching sessions is 1. The latter is true for 12 histone-templates out of 18, or in 2/3 of the cases. Another important observation that can be made from the above table is the fact that the template matching with z-transformed data outperformes by far the other two template matching sessions, in 15 out of 18 cases. In order to facilitate the comparative performance analysis of the 3 sessions, the percentages of histones selected by each of the 3 sessions with respect to the total number of uniquely selected histones by all 3 sessions (column 5 in the table above) for all 18 histone-templates have been depicted in the figure below.
Observe that the best performance that can be achieved with the original time series data (no data adjustment applied) is maximum 50% histones among the first 50 best matching genes (see the blue circles referring to the dtw session). The matching results for the log2-transformed expression data are spread all over with most data points between 25% and 75% (see the green squares referring to the dtw-log2 session). Finally, the results for the z-transformed data are situated mostly in the top part of the plot above 50% with 2/3 above 75% (see the red diamonds referring to the dtw-z session). Clearly, the latter seems to be the most suitable data adjustment, with respect to the template matching performance, when applied to our gene expression test set. However, it may turn out that for another time series data some other data adjustment techniques are more appropriate. The purpose of our histone template matching example is just to demonstrate that the data adjustment applied is very important and a wrong choice may lead to a dramatic reduction in the template matching performance.
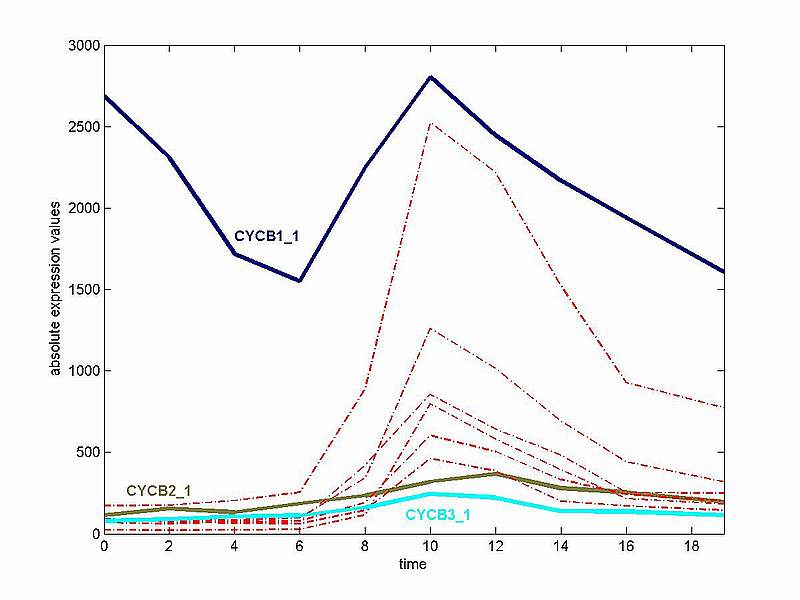
Our aim here is to evaluate in some objective fashion the template matching performance of GenTχWarper. Recall that GenTχWarper is based on the dynamic time warping techniques used in the speech recognition field. These techniques allow for non-linear (elastic) alignment of time profiles and consequently enable detection of similar shapes with different phases. Classical distance metrics as Euclidean or a variation thereof fail to capture temporal variations since they are very sensitive to small distortions in the time axis and consequently, produce poor similarity measures between time series. Pearson correlation is a more robust distance metric in this respect since it is supposed to measure the similarity in shape between two profiles. In view of this, it seems reasonable to benchmark the dynamic time warping distance against the Pearson correlation distance. The formula for the Pearson correlation distance is: d = 1 - r where r = Z(x) · Z(y) / n is the dot product of the z-transformed values of two expression profiles x and y. We have shown above that the z-transform is the best data adjustment with respect to performance that can be applied to our data and consequently, the dynamic time warping distance will be tested with z-transformed expression data. Our test gene expression time series is the same as above, i.e. coming from the Arabidopsis aphidicolin synchronization experiment of Menges et al., 2003(1)(Data) and consists of 3277 genes (selected based on p-values for regulation) sampled 10 times over a period of 19h. The set of all 9 Arabidopsis B-type cyclins presently available on the Affymetrix chip have been selected as a benchmarking set. The B-type cyclins are known to have a peak of transcription during the G2 to M phase transition and it is believed that they are probably responsible for the mitotic events(2). Their expression profiles are depicted in the two consecutive figures below: 1) Absolute Expression Values
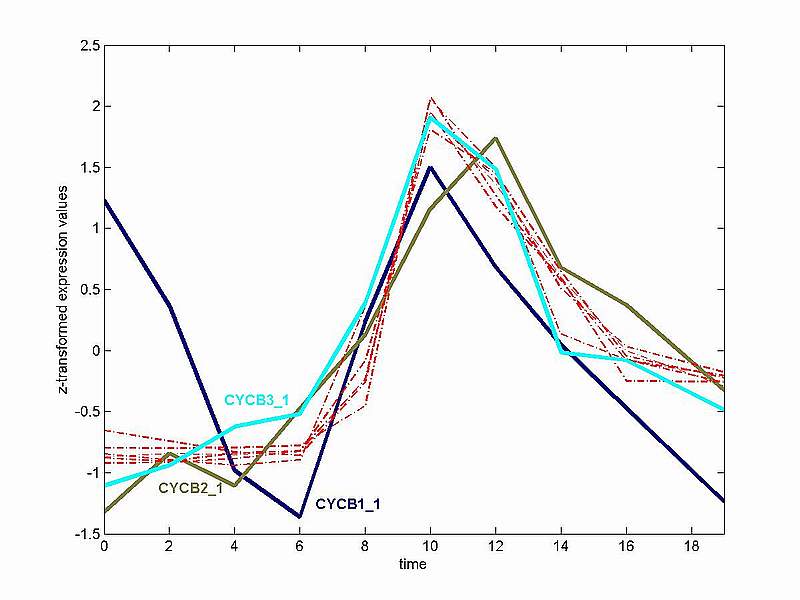
The figure above demonstrates that although the expression of the 9 B-type cyclins is highly fluctuating in the cell cycle, they all have a distinctive peak in early mitosis. Three cyclins (CYCB1_1, CYCB2_1 and CYCB3_1) deviate considerably in expression behaviour from the rest of the group. Consequently their expression profiles are depicted in different colours. The somewhat peculiar expression profile of CYCB1_1 is probably due to some stress response to the aphidicolin synchronization method. The profiles of CYCB2_1 and CYCB3_1 exhibit a lower signal to noise ratio as compared to the rest of the cyclins and the peak of CYCB2_1 seems delayed in time. The latter is more clearly illustrated with the z-transformed profiles in the figure below. 2) Z-transformed Expression Values
All 9 B-type cyclins have been used as templates and for each one of them the first 50 best matching genes have been determined, once using the dynamic time warping (DTW) distance and once using the Pearson correlation distance. Then each best matching list has been subjected to analysis with the BiNGO tool in order to determine which Gene Ontology (GO) categories are statistically overrepresented in each list. The results for a cut-off p-value of 0.05 and using Benjamini & Hochberg (False Discovery Rate) multiple testing correction are presented in the 3 consecutive tables below. Each table is divided into two columns, on the left for the DTW distance and on the right for the Pearson correlation distance. Each of the columns is sub-divided into 4 additional columns containing: 1) the GO category identification (GO-id); 2) the multiple testing corrected p-value (p-value); 3) the number of selected genes versus the total GO number (selected / total); 4) a detailed description of the selected GO categories (description). Alternatively, a pdf file containing all the 3 tables can be found here cyclinsB tables. It was observed above that, probably due to stress response, CYCB1_1 does not exhibit typical B-type cyclin transcription behaviour. This explains the fact that no GO categories are significantly overrepresented in the list of 50 best matching genes for either the DTW or the Pearson correlation distances.
The GO categories selected for CYCB1_3 and CYCB1_4 show considerable over-representation of cell cycle regulation and mitosis control related genes. Observe that for these two cyclins, and in particular for CYCB1_4, the DTW category list clearly outperforms the Pearson correlation both quantitatively (in terms of gene numbers selected, see column 3 'selected/total') and qualitatively (in terms of p-values, see column 2 'p-value'). The same conclusion can be made for CYCB1_5, CYCB2_4 and CYCB2_5 below.
The interpretation of the CYCB2_1 category lists is not so straightforward. Recall that CYCB2_1 is the one that peaks somewhat later in mitosis than the rest of the B-type cyclins (consult the expression profile figures above), which may be due to either stress response or to some specific functional role of this cyclin in the cell cycle. At first sight, it seems that the Pearson correlation performs much better than the DTW distance. The DTW distance identifies only 2 GO categories (both mitosis related), while the Pearson correlation distance produces a much more extensive category list. However, when taking a closer look at the GO categories selected with the correlation, one finds categories as geranylgeranyl reductase activity, chloroplast, plastid, which clearly do not have anything to do with cell cycle processes. In this respect the DTW distance seems to be more specific and false positives are not present in its category list. The lists for CYCB2_2 exhibit an interesting phenomenon. Exactly the same set of GO categories is produced by both distances, DTW and Pearson correlation, but with a completely different statistical significance. Thus the top of the DTW category list is occupied by microtubule motor activity related genes (GO-id: 3777, 3774), while the one of the Pearson correlation by cyclin-dependent protein kinase and regulation of cell cycle associated genes (GO-id: 3753, 74, 19887, 19207). Overall, the GO categories in the DTW list for CYCB2_2 are assigned lower p-values than the corresponding ones in the Pearson correlation list.
The results for CYCB3_1 are also not that easy to interpret. The Pearson correlation distance has identified one more cyclin-dependent protein kinase (GO-id: 3753) than the DTW distance, which is subsequently reflected in all kinase activity and cell cycle regulation related categories (GO-id: 19887, 19207, 74, 7049, 50794, ...). The DTW distance on the other side, has selected 2 more microtubule motor activity related genes (GO-id: 3777, 3774) than the correlation. Overall, it seems that the DTW distance is more successful in identifying microtubule motor activity related genes than the Pearson correlation. The latter is the case for 6 out the 9 cyclins: CYCB1_1, CYCB1_4, CYCB1_5, CYCB2_2, CYCB2_4, and CYCB3_1. A possible explanation for this phenomenon is that the expression profiles of these genes may have higher time progression variability, which consequently, is more adequately captured by the DTW distance. In summary: 1) In 1/9 cases (CYCB1_1) no significant GO categories are found for both distance measures; 2) In 6/9 cases (CYCB1_3, CYCB1_4, CYCB1_5, CYCB2_2, CYCB2_4, CYCB2_5) DTW outperforms the Pearson correlation both quantitatively (in terms of gene numbers selected, see column 3 'selected/total') and qualitatively (in terms of p-values, see column 2 'p-value'); 3) In 1/9 cases (CYCB2_1) Pearson outperforms DTW, but also produces some odd (not cell cycle related) GO categories; 4) In 1/9 cases (CYCB3_1) the performance is difficult to compare since the two distance measures seem to be better in different GO categories.
(1) Sakoe,H. and Chiba, S. Dynamic programming algorithm optimization for spoken word recognition. IEEE Trans. on Acoust., Speech, and Signal Process., ASSP 26, 43-49 (1978). (2) De Veylder,L., Joubès,J., Inzé, D. Plant cell cycle transitions. Current Opinion in Plant Biology 6, 536-543 (2003). (3) Menges,M., Henning,L., Gruissem,W., Murray,A.H. Genome-wide gene expression in an Arabidopsis cell suspension. Plant Molecular Biology, 53, 423-442 (2003).
|
|
|