Merging microarray cell synchronization experiments through curve alignment
In order to have a fair estimate of the performance of the merging algorithm, we need to validate the algorithm on expression data coming from another organism with well established synchronization methods that are able to maintain the synchrony for multiple cell cycles. Subsequently, by downsizing the synchronized expression data from multiple cycle coverage to about 85% of a cycle, the cell-cycle coverage of plant synchronization data can be mimicked. One of the obvious choices is Schizosaccharomyces pombe (fission yeast) as there are synchronization methods reported that manage to synchronize the cells for up to three cell cycles. We have selected the elutriation A and cdc25 experiments of Oliva et al.(1) which are sampled approximately every 10 minutes for 406 minutes, covering about 2.6 cell cycles. Hereafter, we present the results from the periodic analysis performed on: 1) the original 2.6 cell-cycle coverage expression profiles; 2) expression profiles that have been downsized to 85% cell-cycle coverage; 3) expression profiles resulting from merging data coming from the two different synchronization experiments.
The constraining parameters for the yeast periodicity analysis presented here are:
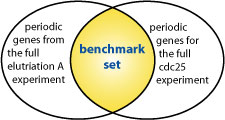
In order to validate the accuracy of periodicity identification on expression profiles composed from different cell synchronization experiments with incomplete cell-cycle coverage, we need to construct a bechmark set of periodic genes. Thus we first identify, following the procedures described in Section 2.3 of the article, the respective set of periodic genes for each of the full (2.6 cell-cycle coverage) elutriation A and cdc25 experiments. Consequently, 249 such genes are identified for elutriation A and 171 for cdc25. Then we consider two different benchmark sets of 'truly' periodic genes:
Subsequently, in order to simulate the best cell cycle coverage achieved with the Arabidopsis synchronization methods, each yeast data set (elutriation A and cdc 25) was downsized to cover about 85% of a single cycle. Note that the quality of the downsized yeast data is still superior to the Arabidopsis one due to the fact that it is originating from multiple cell-cycle coverage. Consequently, the level of synchrony at the end of the downsized yeast data will be still much higher in comparison to the one of Arabidopsis.
Next we proceed with merging together the downsized (to 85% of a single cell cycle) expression profiles of elutriation A and cdc25. Analogously as in Arabidopsis, we have composed a few different sets of genes with well known cell-cycle association or regulation (cyclins, histones, top 10 periodic genes identified for 2.6 cell-cycle coverage) and detemined the optimal pasting overlap using our DTW alignment tool GenTχWarper. The normalized DTW alignment scores of these alignments are reported in the table below:
| offset | cyclins | histones | top 10 periodic | all |
|---|---|---|---|---|
| -100 min | 0.72 | 0.33 | 1.29 | 1.66 |
| -90 min | 0.67 | 0.26 | 1.17 | 1.45 |
| -80 min | 0.73 | 0.41 | 1.11 | 1.45 |
| -70 min | 0.74 | 0.68 | 1.24 | 1.71 |
| 0 min | 0.80 | 1.57 | 2.19 | 3.33 |
| 55 min | 0.71 | 0.8 | 1.03 | 1.67 |
| 65 min | 0.71 | 0.61 | 0.99 | 1.46 |
| 75 min | 0.84 | 0.52 | 1.02 | 1.49 |
| 85 min | 0.93 | 0.57 | 1.28 | 1.80 |
The results in the above table indicate that an offset of -90 minutes for elutriation A compared to cdc 25 can be considered as the best one . This optimal offset entails a specific DTW alignment between the two groups of expression profiles. The DTW alignment obtained for the union of all selected gene sets (the most right column of the above table) is the one that was applied on the entire data set:
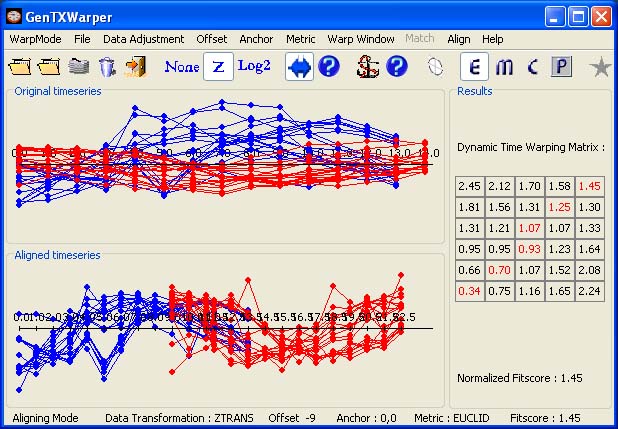
The merging of elutriation A and cdc25 profiles was done as described in Section 2.2 of the article.
Here we compare the results from the periodicity analysis performed on the 3 different expression data sets: ±85% cell-cycle coverage of elutriation A, ±85% cell-cycle coverage of cdc25, and the former two merged with an offset -90 min. In total, 492 genes are identified as periodic from the three different expression sets. The table below presents the TPRs (True Positive Rate or Sensitivity) versus the FPRs (False Positive Rate or 1-Specificity) for the periodic gene lists identified for each of the three expression data sets. In addition, the table presents the TPRs and FPRs for the following 3 periodic gene lists:
| benchmark sets | elut.A | cdc25 | merged | (elut.A and cdc 25) or (elut.A and merged) or (cdc25 and merged) | elut.A or cdc25 or merged | elut.A and cdc25 and merged | |
|---|---|---|---|---|---|---|---|
intersection (periodic: 74, nonperiodic: 4913) |
TPR | 82.4% (61 of 74) |
86.5% (64 of 74) |
79.7% (59 of 74) |
83.8% (62 of 74) |
98.6% (73 of 74) |
66.2% (49 of 74) |
| FPR | 3.6% (177 of 4913) |
5.8% (284 of 4913) |
2.2% (107 of 4913) |
2.5% (123 of 4913) |
8.5% (419 of 4913) |
0.5% (26 of 4913) |
|
| TP/FP | 0.34 |
0.22 |
0.55 |
0.5 |
0.17 | 1.88 |
|
union (periodic: 346, nonperiodic: 4641) |
TPR | 45.7% (158 of 346) |
48.8% (169 of 346) |
34.1% (118 of 346) |
39% (135 of 346) |
69.9% (242 of 346) |
19.7% (68 of 346) |
| FPR | 1.7% (80 of 4641) |
3.9% (179 of 4641) |
1% (48 of 4641) |
1.1% (50 of 4641) |
5.4% (250 of 4641) |
0.2% (7 of 4641) |
|
| TP/FP | 2 |
0.94 |
2.46 |
2.7 |
0.97 | 9.71 |
|
The periodic gene list coming from the merged profiles exhibits the lowest FPRs for both benchmark sets (2.2% for intersection and 1% for union) in comparison to the lists associated with the elutriation A and cdc25 experiments. Moreover, the merged list also outperforms the elutriation A and cdc25 ones in terms of trade-off between true positives and false positives. This is very important feature in a context of periodicity studies, which usually target identification of potentially novel cell-cycle genes. Ultimately, the hypotheses generated in such studies need to be validated experimentally. The latter process can seriously be hampered by very high false positive rates.
Naturally, the best performance in terms of TPR is obtained for the list composed of the genes identified as periodic in at least one of the three expression data sets (the last but one column). However, the same list exhibits also the worst FPRs and consequently, the worst trade-off between true positives and false positives. The lowest FPRs for both benchmark sets (0.5% for intersection and 0.2% for union) is obtained for the list including only genes that were identified as periodic in all three expression data sets (the last column). Unfortunatelly, the latter entails also rather low TPRs. Nevertheless, the list of periodic genes identified in all three data sets still represents the best trade-off between true positives and false positives.
The set of periodic genes identified in at least 2 data sets '(elut.A and cdc 25) or (elut.A and merged) or (cdc25 and merged)' may also be an interesting target for further experimental cell-cycle studies. It outperforms the merged list in terms of TPRs, while its FPRs degrade only slightly.
A more detailed analysis of the results from the periodicity analysis performed on each of the benchmark sets is presented below.
 section benchmark set
 In total, 73 from the 74 benchmark genes are identified as periodic from all the 3 different expression data sets . However, this comes with the cost of 419 false positives. This means that at average only 1 of 6 genes is correctly identified as periodic, i.e. was also identified as periodic for the full (2.6 coverage) expression profiles.
The resulting overlaps between the three different sets of periodic genes are illustrated in the Venn diagrams below:
The different sets are represented as the number of genes belonging to the benchmark set (the 'truly' periodic genes identified for the full 2.6 cell-cycle coverage) versus the total number of periodic genes belonging to the particular set.
The sets are represented in terms of percentage of benchmark genes found in each set, i.e. an indication of the accuracy performance of the different expression data sets is obtained.
 |
 |
The number of genes belonging to the bechmark set are given in bold. The second non-bold number is the total number of genes that are reported as periodic for the particular set. |
Each set represents the percentage of benchmark genes found in it. For example, from the 100 genes that were identified as periodic in the upper right partial set, 2% (2 of 100) falls in the benchmark set. |
The left Venn diagram shows that the number of benchmark periodic genes, detected for the different experiments is more or less the same: 61 for elutriation A, 64 for cdc25, and 59 for the merged one. However, as it can be seen in the right Venn diagram, these represent very different proportion of the total set of periodic genes indentified for each data set: 25.6% for elutriation A, 18.4% for cdc25, and 35.5% for the merged data set. Thus the number of false positives is drastically reduced (almost twice in comparison to cdc25) when looking at the merged set. This finding is also reflected in the FPR (False Positive Rate) plot below. In addition, the intersection of the three periodic gene sets contains 65.3% benchmark genes correctly identified as periodic.
Furtehrmore, we compare for the three different data sets the evolution of the FPR (False Positive Rate) as a function of λreg for a fixed significance threshold 0.05 and λper = 1. The FPR is defined as the percentage of periodic genes, identified for each of the three different data sets, falling outside the benchmark set with respect to all genes outside the benchmark set. The FPR curves for the three experiments are depicted in the plot below. The FPR of the merged set outperformes the ones of the individual experiments. The difference in percentage seems very small, but one should consider that almost 5000 genes are left out of our benchmark set. Then the difference between 2% and 5% FPR is in the range of 150 more false positive genes.
 In total, 242 from the 346 benchmark genes are identified as periodic from all the 3 different expression data sets . However, this comes with the cost of 250 false positive. This means that at average only half of the genes are correctly identified as periodic, i.e. were also identified as periodic for the full (2.6 coverage) expression profiles.
The resulting overlaps between the three different sets of periodic genes are illustrated in the Venn diagrams below:
The different sets are represented as the number of genes belonging to the benchmark set (the 'truly' periodic genes identified for the full 2.6 cell-cycle coverage) versus the total number of periodic genes belonging to the particular set.
The different sets are represented in terms of percentage of benchmark genes found in each set, i.e. an indication of the accuracy performance of the different expression data sets is obtained.
 |
 |
The number of genes belonging to the bechmark set are given in bold. The second non-bold number is the total number of genes that are reported as periodic for the particular set. |
Each set represents the percentage of benchmark genes found in it. For example, from the 100 genes that were identified as periodic in the upper right partial set, 39% (39 of 100) falls in the benchmark set. |
The left Venn diagram shows that the number of benchmark periodic genes, indentified from elutriation A and cdc 25 expression profiles is considerably higher than the genes detected with the merged data, 158 for elutriation A and 169 for cdc25 versus only 118 for the merged list. However, the elutriation A and cdc25 gene sets contain also a higher number of false positives in comparison to the merged list. This can clearly be seen in the right Venn diagram, the proportion of correctly identified as periodic benchmark genes for each data set is as follows: 66% for elutriation A, 48% for cdc25, and 71% for the merged data set. The intersection of the three periodic gene sets is also considerably enriched with benchmark genes, namely it contains 91% benchmark genes correctly identified as periodic.
The FPR (False Positive Rate) plot for the union benchmark set is comparable to the one for the intersection.
(1) Oliva,A., Rosebrock,A., Ferrezuelo,F., Pyne,S., Chen,H., Skiena,S. The cell cycle-regulated genes of Schizosaccharomyces pombe. PLOS, 3 7, 1239-1260 (2005).