Merging microarray cell synchronization experiments through curve alignment
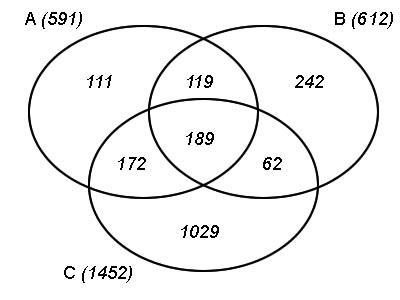
The Venn diagrams show the overlap of genes that are classified as periodic. Every set comes from a different synchronization method or from the merging of synchronization methods. Thus set A represents the number of genes identified as periodic from the merged (aphidicolin and sucrose) profiles: (left) -14h offset (right) 6h offset. Set B represents the periodic genes found in the aphidicolin-synchronized profiles and set C in the sucrose-starved ones.
Recall that for the merged expression profiles, the p-values for regulation were obtained as the geometric mean of the individual p-values for regulation estimated separately for the original aphidicolin and sucrose profiles. This implies however that genes with preg=1, i.e. absolutely not significantly expressed and hence having a rather flat expression profile for one of the data sets and preg close to zero for the other data set, may also be considered. In order to avoid this, the p-values for regulation of the merged profiles were composed by imposing the additional constraint that each individual p-value for regulation cannot exceed 0.5. Thus for a given regulation significance level, a gene will be considered expressed in the merged data sets if: 1) the gene is significantly expressed in at least one of the experiments; 2) there is at least 50% chance that it is expressed in the other experiment; 3) its merged p-value for regulation does not exceed the significance level.
The constraining parameters for the case that is included in the article (fig. 7) are:

|
|
|
|
| Click on the partial set of interest to see the GO categories that are overrepresented in that particular set. | |