Merging microarray cell synchronization experiments through curve alignment
In order to determine the optimal pasting overlap between the aphidicolin-synchronized expression profiles and the sucrose-starved ones, 5 different sets of genes with well known cell-cycle association were composed. These are B-type cyclins, A-type cyclins, all cyclins, all histones, and all cyclins and histones together. A pairwise DTW alignment of the time series coming from the different synchronization experiments was performed for the selected set of genes and for a varying offset value using GenTχWarper. Applying an offset means sliding the time series against each other along the time axis. Due to the fact that cell-cycle progression is a periodic process, any pair of cell synchronized expression time series can be aligned against each other in two different ways:
A pair of optimal alignment offsets (positive and negative) for the aphidicolin and the sucrose expression profiles was determined based on the DTW scores. Thus the two sets of expression profiles could be merged together in two different ways: 1) with a positive offset of 6h or 2) with a negative offset of 14h. Each of these offsets entails a specific DTW alignment between the two groups of expression profiles. The DTW alignments obtained for the union of all selected cell-cycle associated gene sets are the ones that were applied on the entire data set.
The time expression profiles of all selected cell-cycle associated genes from the aphidicolin-synchronization experiment of Menges et al., 2003(1) (Data) were loaded into GenTχWarper and displayed in blue. Next, the time expression profiles of these genes from the sucrose-starvation experiment of Menges et al., 2003(1) (Data) were loaded and displayed in red.
The two sets of expression profiles have been generated in different experimental conditions and consequently, the comparison of their absolute expression values will not be very meaningful. Therefore before proceeding with aligning the two sets of profiles they were z-transformed.
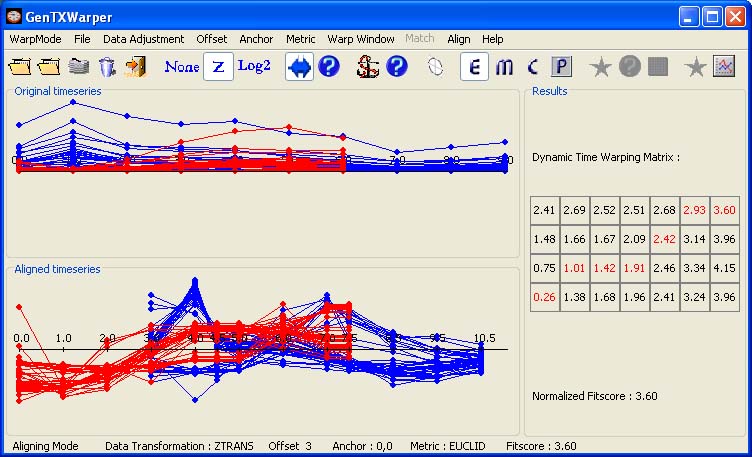
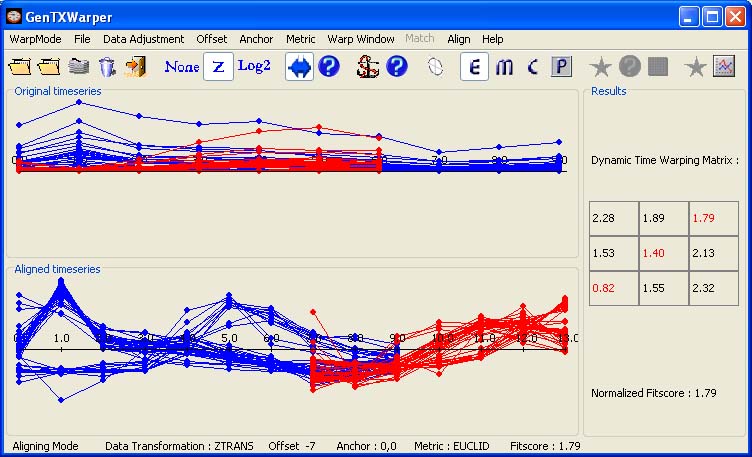
The two visualization panels provide a comparative view of
1) the original expression profiles (top panel);
2) their aligned with the DTW algorithm counterparts (bottom panel).
Additionally, GenTχWarper reports in the right window the DTW matrix with the optimal warping path through it indicated in red, and the final fitscore after normalization.
(1) Menges,M., Henning,L., Gruissem,W., Murray,A.H. Genome-wide gene expression in an Arabidopsis cell suspension. Plant Molecular Biology, 53, 423-442 (2003).