BiNGO


BiNGO tutorial
Step 1
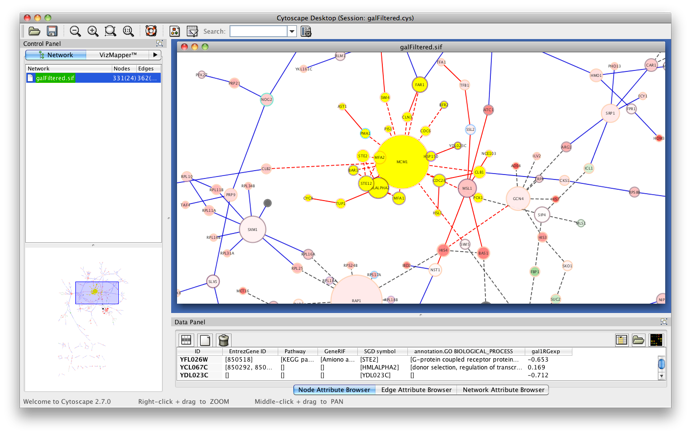
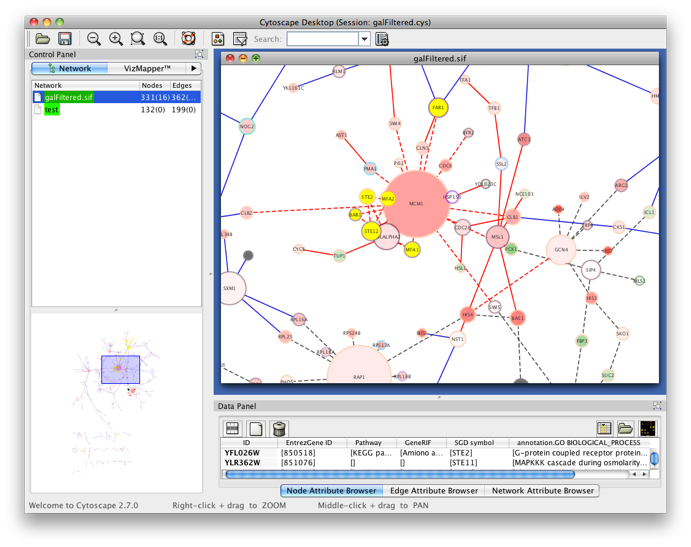
Start Cytoscape and load the network galFiltered.cys from the sampleData folder in the Cytoscape directory. Select a cluster of genes from the network (indicated in yellow). Select BiNGO from the Plugins menu.
Step 2
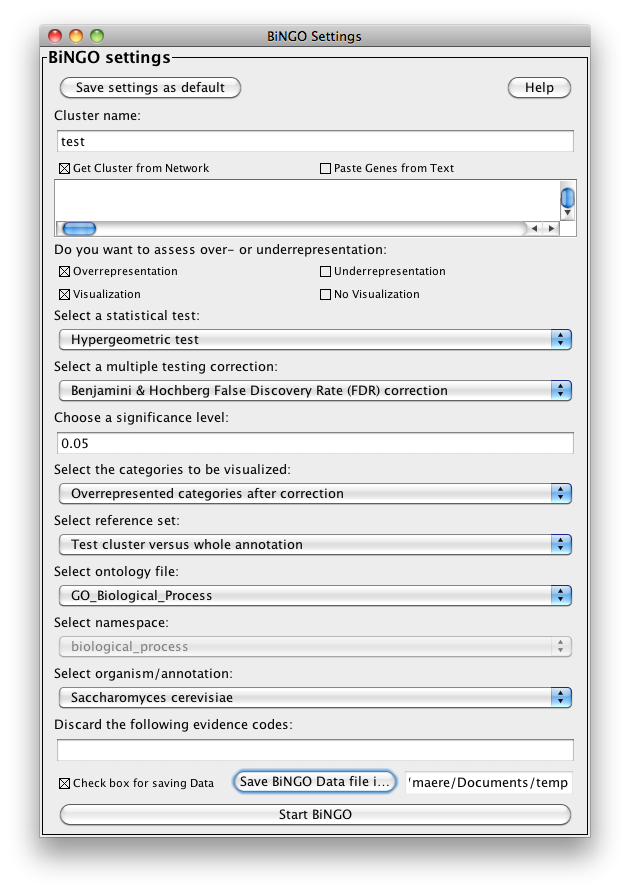
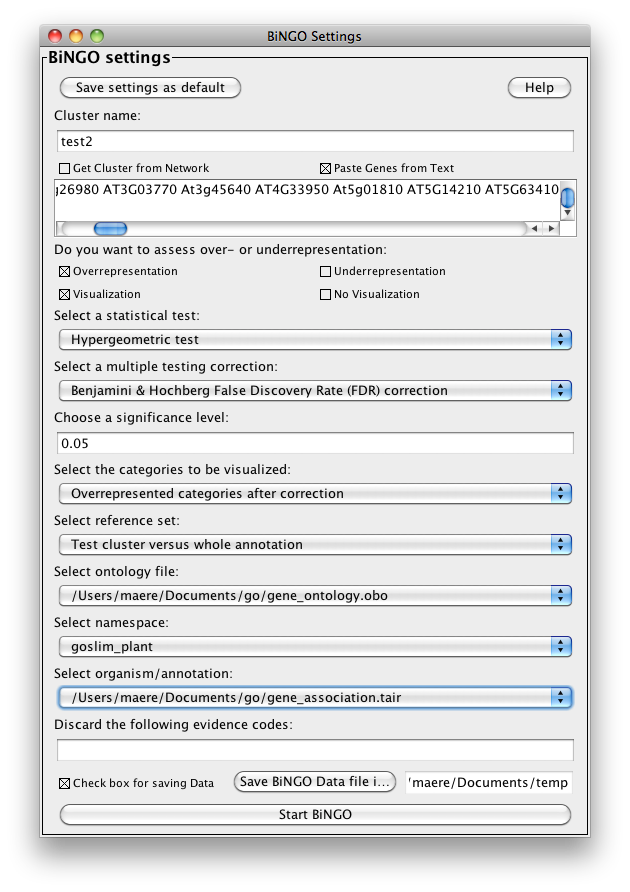
The BiNGO Settings panel pops up. Start by filling in a name for your cluster. This name will be used for creating the output file and the visualization of the results in Cytoscape. Check the box Get Cluster from Network (see below for an example with text input). We want to assess overrepresentation of GO categories, and we want to visualize the results in Cytoscape. The corresponding boxes are checked accordingly by default. Then select a statistical test (the Hypergeometric Test is exact and equivalent to an exact Fisher test, the Binomial Test is less accurate but quicker) and a multiple testing correction (we recommend Benjamini & Hochberg's FDR correction, the Bonferroni correction will be too conservative in most cases), and choose a significance level, e.g. 0.05. Since we only want to visualize those GO categories that are overrepresented after multiple testing correction, and their parents in the GO hierarchy, select the corresponding visualization option. We're interested in assessing the overrepresentation of functional categories in our cluster with respect to the whole yeast genome, which is why we choose the Complete Annotation as the reference set. Select GO_Biological_Process from the ontology list, and Saccharomyces cerevisiae from the organism list. We want to consider all evidence codes, so don't fill in anything in the evidence code box. Finally, select a directory to save the output file in (the file will be named test.bgo if you filled in test as a cluster name), and press Start BiNGO...
Step 3
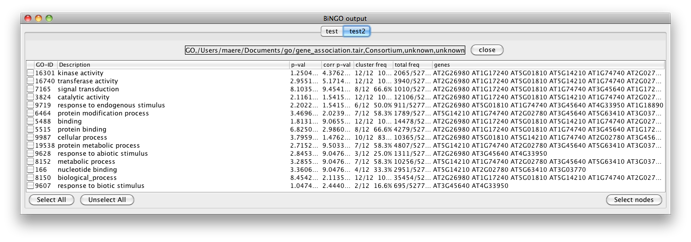
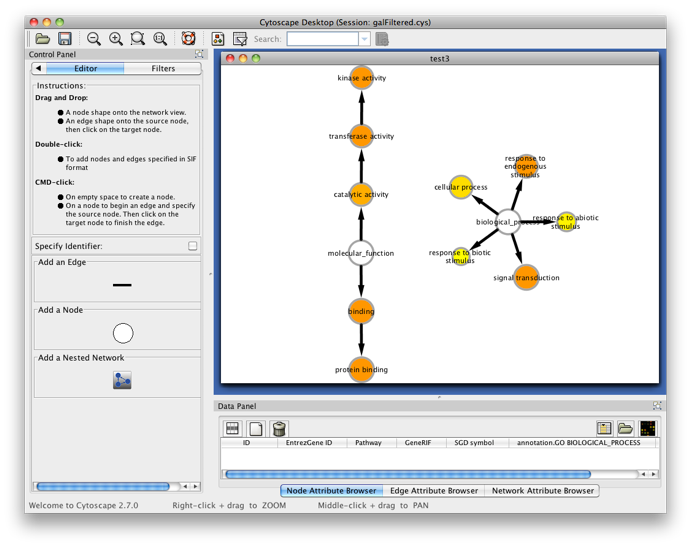
The program will inform you of its progress while parsing the annotations and calculating the tests, corrections and layout. Finally, a visualization of the overrepresented GO categories is created in Cytoscape. Uncolored nodes are not overrepresented, but they are the parents of overrepresented categories further down. Yellow nodes represent GO categories that are overrepresented at the significance level . For more significant p-values, the node color gets increasingly more orange (see also the Color Legend panel). If you'd like another layout, e.g. hierarchical, select the corresponding option from the Cytoscape Visualization menu. Regardless of the layout you choose, you'll probably have to tweak the nodes a little in order to avoid overlapping node labels. The list of significantly overrepresented functional categories is shown in the BiNGO output window (more information on the cluster and options you selected, and on which genes did not produce any annotation, is stored in the test.bgo file). Congratulations ! You just performed your first BiNGO analysis...
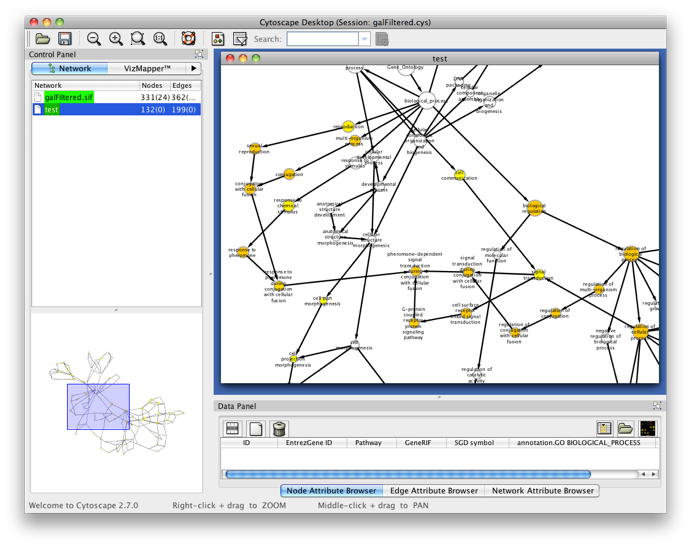
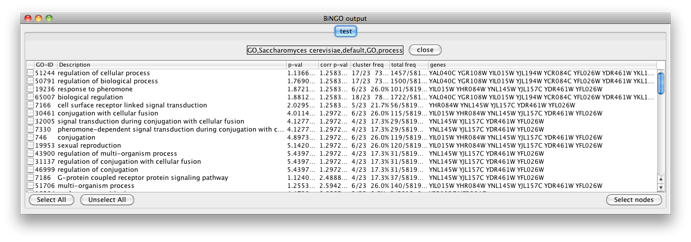
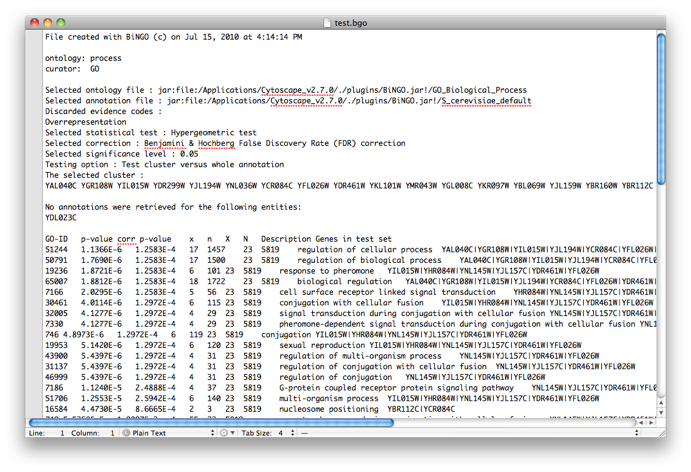
Select some interesting GO categories by checking the boxes on the left side of the BiNGO output window. Then press the Select nodes button. All nodes in the original Cytoscape network (not only in the selected cluster) annotated to one of these categories are highlighted.
Step 4
Go back to the network by clicking on the galFiltered.sif in the left panel on the Cytoscape desktop, and select another cluster of genes. Go to the BiNGO Settings panel (you DON'T have to start a new BiNGO session), choose a new cluster name and adjust some of the settings you made earlier. As an alternative to using the cluster you selected in the network, you can check the box Paste Genes from Text (shown below) and paste some white-space delimited gene names, e.g. some Arabidopsis AGI codes, a.k.a. Locus Tags, e.g. (case doesn't matter)
At1g17240 At1g17250 At1g18890 At1g74740 AT2G02780 At2g26980 AT3G03770 At3g45640 AT4G33950 At5g01810 AT5G14210 AT5G63410
which is basically a set of protein kinases. This time, we will use a custom annotation and ontology file. Download the files gene_association.tair and gene_ontology.obo from www.geneontology.org and save them somewhere on your computer. Specify these files under Custom... in the Select organism/annotation and Select ontology file panels, respectively, and set Namespace to goslim_plant (this is a slimmed-down version of GO for plants). Hit the Start BiNGO button again.
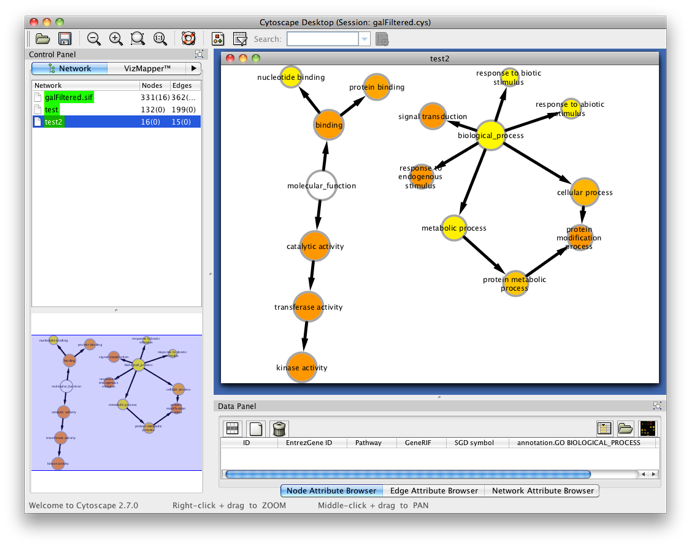
Step 5
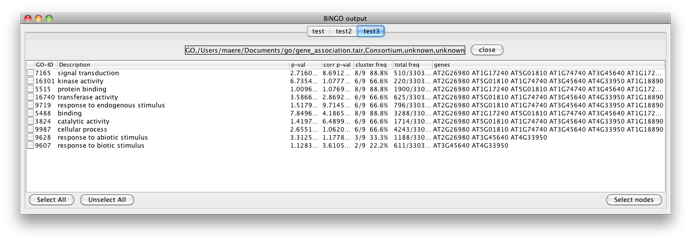
You will get the following screen. Observe that you can perform as many tests as you want in a single BiNGO session. The resulting GO subnetworks will be labeled with the names you gave to the clusters, and each BiNGO network has its own visual style (called BiNGO Style for <cluster name> in Cytoscape’s Vizmapper), mapping attributes such as p-values and number of genes in the cluster belonging to a certain GO category to the color and the size of the nodes, respectively.
Try some other settings and options. In most cases, BiNGO will stop you if you're about to do something wrong. Still, there are several peculiarities and potential pitfalls you should keep in mind while using BiNGO. Please look at the Manual and the FAQ for more details.
Step 6
Return to the BiNGO Settings panel and rename the cluster of Arabidopsis genes 'test3'. We'll perform exactly the same analysis, except that annotations inferred from electronic annotation (IEA) and sequence similarity (ISS) will be discarded. Fill in 'IEA' and 'ISS' in the evidence code text field and run BiNGO again. The results will be similar, but for instance, 6 out of 12 genes are no longer annotated to the kinase activity category.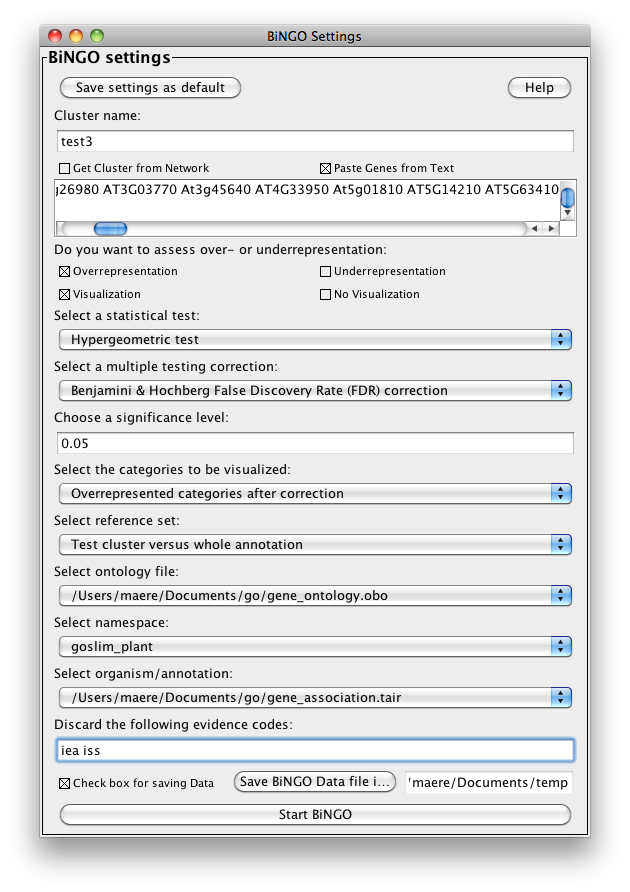
Copyright (c) 2005-2016 VIB